 Web Server Statistics for reemainvest.com
Program started on Sun, Oct 29 2017 at 3:23 PM.
Analyzed requests from Wed, Mar 29 2017 at 7:24 PM to Sat, Oct 28 2017 at 4:36 PM (212.88 days).
Web Server Statistics for reemainvest.comProgram started on Sun, Oct 29 2017 at 3:23 PM.
Analyzed requests from Wed, Mar 29 2017 at 7:24 PM to Sat, Oct 28 2017 at 4:36 PM (212.88 days).
(Go To: Top | General Summary | Monthly Report | Daily Summary | Hourly Summary | Domain Report | Organization Report | Browser Report | Browser Summary | Operating System Report | Status Code Report | File Size Report | File Type Report | Directory Report | Request Report)
Figures in parentheses refer to the 7-day period ending Oct 29 2017 at 3:23 PM.
Successful requests: 181 (0)
Successful requests for pages: 180 (0)
Failed requests: 786 (9)
Distinct files requested: 3 (0)
Distinct hosts served: 12 (0)
Data transferred: 3.33 megabytes (0 bytes)
Average data transferred per day: 16.00 kilobytes (0 bytes)
(Go To: Top | General Summary | Monthly Report | Daily Summary | Hourly Summary | Domain Report | Organization Report | Browser Report | Browser Summary | Operating System Report | Status Code Report | File Size Report | File Type Report | Directory Report | Request Report)
Each unit ( ) represents 2 requests for pages or part thereof.
| month | #reqs | #pages | |
|---|---|---|---|
| Mar 2017 | 2 | 2 | |
| Apr 2017 | 5 | 5 |  |
| May 2017 | 1 | 0 | |
| Jun 2017 | 0 | 0 | |
| Jul 2017 | 0 | 0 | |
| Aug 2017 | 68 | 68 |  |
| Sep 2017 | 40 | 40 |   |
| Oct 2017 | 65 | 65 | |
Busiest month: Aug 2017 (68 requests for pages).
(Go To: Top | General Summary | Monthly Report | Daily Summary | Hourly Summary | Domain Report | Organization Report | Browser Report | Browser Summary | Operating System Report | Status Code Report | File Size Report | File Type Report | Directory Report | Request Report)
Each unit () represents 2 requests for pages or part thereof.
| day | #reqs | #pages | |
|---|---|---|---|
| Sun | 18 | 18 |  |
| Mon | 16 | 16 | |
| Tue | 40 | 40 | |
| Wed | 6 | 5 | |
| Thu | 60 | 60 | |
| Fri | 36 | 36 | |
| Sat | 5 | 5 | |
(Go To: Top | General Summary | Monthly Report | Daily Summary | Hourly Summary | Domain Report | Organization Report | Browser Report | Browser Summary | Operating System Report | Status Code Report | File Size Report | File Type Report | Directory Report | Request Report)
Each unit () represents 1 request for a page.
| hour | #reqs | #pages | |
|---|---|---|---|
| 0 | 0 | 0 | |
| 1 | 23 | 23 | |
| 2 | 22 | 22 | |
| 3 | 0 | 0 | |
| 4 | 10 | 10 | |
| 5 | 5 | 5 | |
| 6 | 5 | 5 | |
| 7 | 1 | 1 | |
| 8 | 0 | 0 | |
| 9 | 7 | 7 | |
| 10 | 18 | 18 | |
| 11 | 13 | 13 | |
| 12 | 0 | 0 | |
| 13 | 8 | 7 | |
| 14 | 16 | 16 | |
| 15 | 2 | 2 | |
| 16 | 16 | 16 | |
| 17 | 0 | 0 | |
| 18 | 12 | 12 | |
| 19 | 3 | 3 | |
| 20 | 0 | 0 | |
| 21 | 13 | 13 | |
| 22 | 0 | 0 | |
| 23 | 7 | 7 | |
(Go To: Top | General Summary | Monthly Report | Daily Summary | Hourly Summary | Domain Report | Organization Report | Browser Report | Browser Summary | Operating System Report | Status Code Report | File Size Report | File Type Report | Directory Report | Request Report)
Listing domains, sorted by the amount of traffic.
| #reqs | %bytes | domain |
|---|---|---|
| 181 | 100% | [unresolved numerical addresses] |
(Go To: Top | General Summary | Monthly Report | Daily Summary | Hourly Summary | Domain Report | Organization Report | Browser Report | Browser Summary | Operating System Report | Status Code Report | File Size Report | File Type Report | Directory Report | Request Report)

Listing organizations, sorted by the number of requests.
| #reqs | %bytes | organization |
|---|---|---|
| 80 | 138.246 | |
| 44 | 44.90% | 45 |
| 20 | 20.41% | 52 |
| 18 | 18.37% | 172.104 |
| 11 | 11.22% | 13 |
| 5 | 5.10% | 54 |
| 2 | 129.78 | |
| 1 | 40 |
(Go To: Top | General Summary | Monthly Report | Daily Summary | Hourly Summary | Domain Report | Organization Report | Browser Report | Browser Summary | Operating System Report | Status Code Report | File Size Report | File Type Report | Directory Report | Request Report)
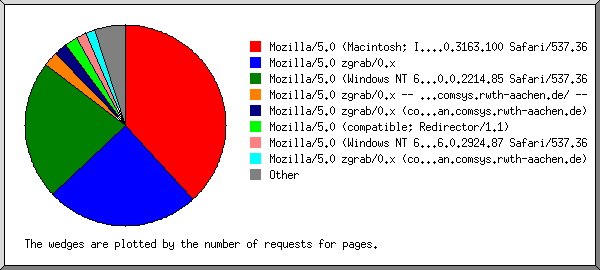
Listing browsers with at least 1 request for a page, sorted by the number of requests for pages.
| #reqs | #pages | browser |
|---|---|---|
| 82 | 82 | Mozilla/5.0 (Windows NT 6.1; Win64; x64) AppleWebKit/537.36 (KHTML, like Gecko) Chrome/40.0.2214.85 Safari/537.36 |
| 18 | 18 | Mozilla/5.0 (Macintosh; Intel Mac OS X 10_12_6) AppleWebKit/537.36 (KHTML, like Gecko) Chrome/61.0.3163.100 Safari/537.36 |
| 18 | 18 | Mozilla/5.0 (compatible; Redirector/1.1) |
| 16 | 16 | Mozilla/5.0 (Windows NT 6.1; WOW64) AppleWebKit/537.36 (KHTML, like Gecko) Chrome/56.0.2924.87 Safari/537.36 |
| 11 | 11 | Mozilla/5.0 zgrab/0.x |
| 8 | 8 | Mozilla/5.0 (Macintosh; Intel Mac OS X 10_12_3) AppleWebKit/537.36 (KHTML, like Gecko) Chrome/56.0.2924.87 Safari/537.36 |
| 8 | 8 | Mozilla/5.0 (Macintosh; Intel Mac OS X 10.11; rv:51.0) Gecko/20100101 Firefox/51.0 |
| 7 | 7 | python-requests/2.18.1 |
| 6 | 6 | Mozilla/5.0 (Macintosh; Intel Mac OS X 10_12_3) AppleWebKit/602.4.8 (KHTML, like Gecko) Version/10.0.3 Safari/602.4.8 |
| 6 | 6 | Mozilla/5.0 (Windows NT 6.1; WOW64; rv:51.0) Gecko/20100101 Firefox/51.0 |
(Go To: Top | General Summary | Monthly Report | Daily Summary | Hourly Summary | Domain Report | Organization Report | Browser Report | Browser Summary | Operating System Report | Status Code Report | File Size Report | File Type Report | Directory Report | Request Report)
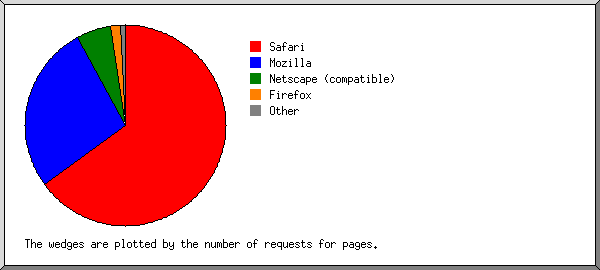
Listing browsers with at least 1 request for a page, sorted by the number of requests for pages.
| # | #reqs | #pages | browser |
|---|---|---|---|
| 1 | 130 | 130 | Safari |
| 124 | 124 | Safari/537 | |
| 6 | 6 | Safari/602 | |
| 2 | 18 | 18 | Netscape (compatible) |
| 3 | 14 | 14 | Firefox |
| 14 | 14 | Firefox/51 | |
| 4 | 11 | 11 | Mozilla |
| 5 | 7 | 7 | python-requests |
| 7 | 7 | python-requests/2 |
(Go To: Top | General Summary | Monthly Report | Daily Summary | Hourly Summary | Domain Report | Organization Report | Browser Report | Browser Summary | Operating System Report | Status Code Report | File Size Report | File Type Report | Directory Report | Request Report)

Listing operating systems, sorted by the number of requests for pages.
| # | #reqs | #pages | OS |
|---|---|---|---|
| 1 | 104 | 104 | Windows |
| 104 | 104 | Unknown Windows | |
| 2 | 40 | 40 | Macintosh |
| 3 | 36 | 36 | OS unknown |
(Go To: Top | General Summary | Monthly Report | Daily Summary | Hourly Summary | Domain Report | Organization Report | Browser Report | Browser Summary | Operating System Report | Status Code Report | File Size Report | File Type Report | Directory Report | Request Report)

Listing status codes, sorted numerically.
| #reqs | status code |
|---|---|
| 181 | 200 OK |
| 8 | 400 Bad request |
| 778 | 404 Document not found |
(Go To: Top | General Summary | Monthly Report | Daily Summary | Hourly Summary | Domain Report | Organization Report | Browser Report | Browser Summary | Operating System Report | Status Code Report | File Size Report | File Type Report | Directory Report | Request Report)
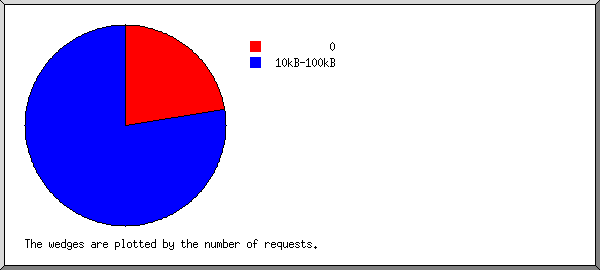
| size | #reqs | %bytes |
|---|---|---|
| 0 | 83 | |
| 1B- 10B | 0 | |
| 11B- 100B | 0 | |
| 101B- 1kB | 0 | |
| 1kB- 10kB | 0 | |
| 10kB-100kB | 98 | 100% |
(Go To: Top | General Summary | Monthly Report | Daily Summary | Hourly Summary | Domain Report | Organization Report | Browser Report | Browser Summary | Operating System Report | Status Code Report | File Size Report | File Type Report | Directory Report | Request Report)
Listing extensions with at least 0.1% of the traffic, sorted by the amount of traffic.
| #reqs | %bytes | extension |
|---|---|---|
| 180 | 100% | [directories] |
| 1 | [not listed: 1 extension] |
(Go To: Top | General Summary | Monthly Report | Daily Summary | Hourly Summary | Domain Report | Organization Report | Browser Report | Browser Summary | Operating System Report | Status Code Report | File Size Report | File Type Report | Directory Report | Request Report)
Listing directories with at least 0.01% of the traffic, sorted by the amount of traffic.
| #reqs | %bytes | directory |
|---|---|---|
| 181 | 100% | [root directory] |
(Go To: Top | General Summary | Monthly Report | Daily Summary | Hourly Summary | Domain Report | Organization Report | Browser Report | Browser Summary | Operating System Report | Status Code Report | File Size Report | File Type Report | Directory Report | Request Report)

Listing files with at least 20 requests, sorted by the number of requests.
| #reqs | %bytes | last time | file |
|---|---|---|---|
| 180 | 100% | Oct/21/17 6:48 AM | / |
| 1 | May/ 3/17 1:11 PM | [not listed: 1 file] |